
ELK介绍
ELK是三个开源软件的缩写:Elasticsearch , Logstash, Kibana .
Elasticsearch是个开源分布式搜索引擎,提供搜集、分析、存储数据三大功能。具有分布式,零配置,自动发现,索引自动分片,索引副本机制,restful风格接口,多数据源,自动搜索负载等特点。
Logstash是日志搜集、分析和过滤的工具,支持大量的数据获取方式。一般工作方式为c/s架构,client端安装在需要收集日志的主机上,server端负责将收到的各节点日志进行过滤、修改等操作后,一并发往elasticsearch上存储。
Kibana可以为 Logstash 和 ElasticSearch 提供的日志分析友好Web 界面,可以帮助汇总、分析和搜索重要数据日志。
ELK是主要用于收集(L:Logstash),存储分析(E:Elasticsearch),可视化日志(K:Kibana)。适用于分布式、推荐系统、大数据等场景下的日志处理应用。
Elasticsearch安装
-
确保jdk环境变量配置正确。
-
下载并解压Elasticsearch。
下载地址: https://www.elastic.co/downloads/elasticsearch
解压: tar -zxvf elasticsearch-6.4.2.tar.gz
修改配置文件以允许外网访问:
cd /usr/local/elasticsearch/config
vi elasticsearch.yml

修改network.host值
network.host: 0.0.0.0
- 使用普通用户登陆
我是部署在/usr/local下,故需要先把文件夹改为普通用户所有,不然无法写入elasticsearch目录,如果本来就部署在用户文件夹刚不需要。
chown -R x:x elasticsearch*
其中x为我的普通用户名。
[x@PC ~]$ /usr/local/elasticsearch/bin/elasticsearch
第一次执行可能会报错:
ERROR: [2] bootstrap checks failed
[1]: max file descriptors [4096] for elasticsearch process is too low, increase to at least [65536]
[2]: max virtual memory areas vm.max_map_count [65530] is too low, increase to at least [262144]
- 出错处理办法:
for elasticsearch process is too low, increase to at least [65536] 修改办法:
vi /etc/security/limits.conf
注意:请将x修改为你对应的登陆的用户名
x hard nofile 65536
x soft nofile 65536
[1024] for user [apps] is too low, increase to at least [2048]
修改办法:
vi /etc/security/limits.d/20-nproc.conf
将
* soft nproc 1024
#修改为
* soft nproc 2048
nt [65530] likely too low, increase to at least [262144] 修改办法:
vi /etc/sysctl.conf
添加下面配置:
vm.max_map_count=655360
修改完sysctl.conf 之后并执行命令:
sysctl -p
注意:如果是用的archlinux,参考如下内容修改:
Note: /etc/security/limits.conf does not work if systemd exists. The files /etc/systemd/system.conf, /etc/systemd/user.conf, and /etc/systemd/
/override.conf would control the limit. See the systemd-system.conf(5) man page for details.
具体来说是要在/etc/systemd/system.conf中修改相应限制。还有部分限制在/etc/security/limits.conf中。 对于vm.max_map_count,
# sysctl -w vm.max_map_count=262144
要永久生效,则
vi /etc/sysctl.d/99-sysctl.conf
添加下面一行
vm.max_map_count = 262144
archlinux安装完后则需要重启下。
- 再次启动elasticsearch,运行正常了。
[x@PC ~]$ curl -XGET localhost:9200验证是否运行正常。
Logstash安装
- 下载并解压。
下载地址: https://www.elastic.co/downloads/logstash
解压: tar -zxvf logstash-6.4.2.tar.gz
- 创建配置文件
cd /usr/local/logstash/config
vi logstash.conf
内容如下:
input { file { type => "log" path => "/home/x/logs/*.log" start_position => "beginning" } } output { stdout { codec => rubydebug { } } elasticsearch { hosts => "127.0.0.1" index => "log-%{+YYYY.MM.dd}" } }
input ,filter,output三大块, 其中input是吸取logs文件下的所有log后缀的日志文件,filter是一个过滤函数,这里不用配置,output配置了导入到 hosts为127.0.0.1:9200的elasticsearch中,每天一个索引,所以可以自己设置,es速度快原因之一倒排索引
- 启动logstash
[x@PC ~]$ /usr/local/logstash/bin/logstash -f /usr/local/logstash/config/logstash.conf
- 验证配置是否正确
logstash监听的是/home/x/logs目录下的*.log文件,写一个文件进去,若能收集到,刚说明配置正确。
cd /home/x/logs
echo "is that ok" >> log1.log
下面就是logstash打印出来的,可见已经收集到了,
{ “@version” => “1”, “host” => “localhost.localdomain”, “path” => “/home/x/logs/log1.log”, “@timestamp” => 2018-10-18T10:31:03.724Z, “message” => “is that ok”, “type” => “log” }
Kibana安装
- 下载并解压。
下载地址: https://www.elastic.co/downloads/kibana
解压: tar -zxvf kibana-6.4.2.tar.gz
- 创建配置文件
cd /usr/local/kibana/config
vi kibana.yml
将
server.host: "localhost"
修改为
server.host: 0.0.0.0
- 启动
[x@PC ~]$ /usr/local/kibana/bin/kibana
- 验证配置是否正确
浏览器访问:http://localhost:5601
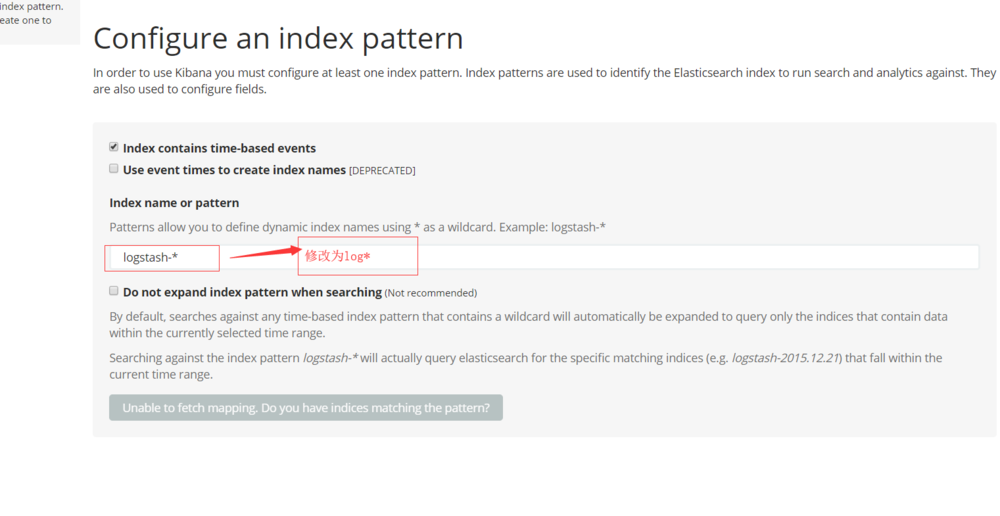
点击Visualize标签,修改index pattern为 log* ,点击下一步,选择@timestamp即可。
版权声明:本文为博主原创文章,转载请注明出处。 旭日酒馆